APEXAdvance Plant Excellence

Platform · 03

From alarm to the device, on any plant type

Alarm console, analytics and response. Single-line diagram, array map, equipment tree and Array 3D. Transformer, switchgear and feeder condition. Geothermal, coal, LNG, steam field and door access.

Alarms › Console

Alarm console

The console shows priority, category, age and acknowledgement. Shelving follows ISA-18.2: a shelved alarm leaves every other screen but stays visible here, with its remaining time, so nobody loses track of what has been suppressed.
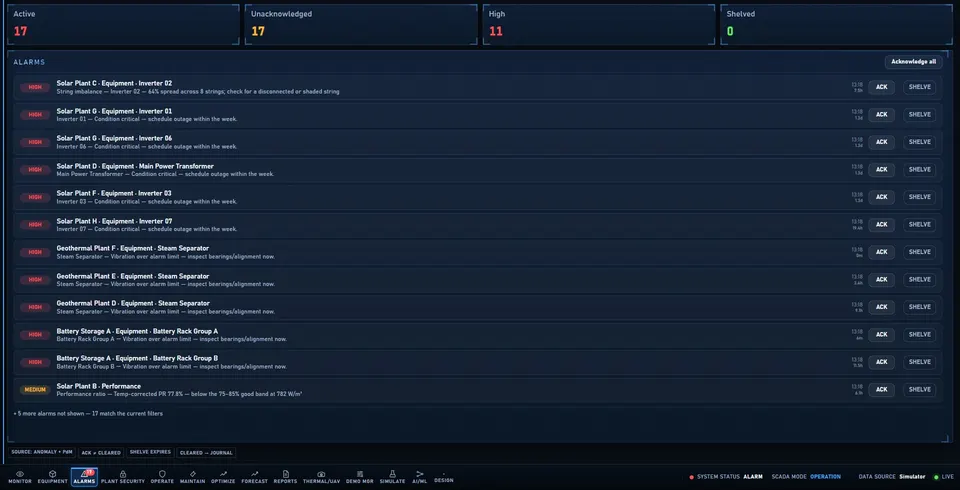
  • Priority and age. Every alarm with priority, category, age and acknowledgement state.
  • Ack and Ack-all. Acknowledge one alarm or the whole list.
  • ISA-18.2 shelving. Shelve a nuisance alarm for a set time; the console still shows it with time left.
  • Click for detail. Any row opens that alarm's full response page.
Alarm console with priority, acknowledgement and ISA-18.2 shelving
Screens shown use simulated demonstration data.

Alarms › Analytics and Response

Alarm analytics, and one alarm in full

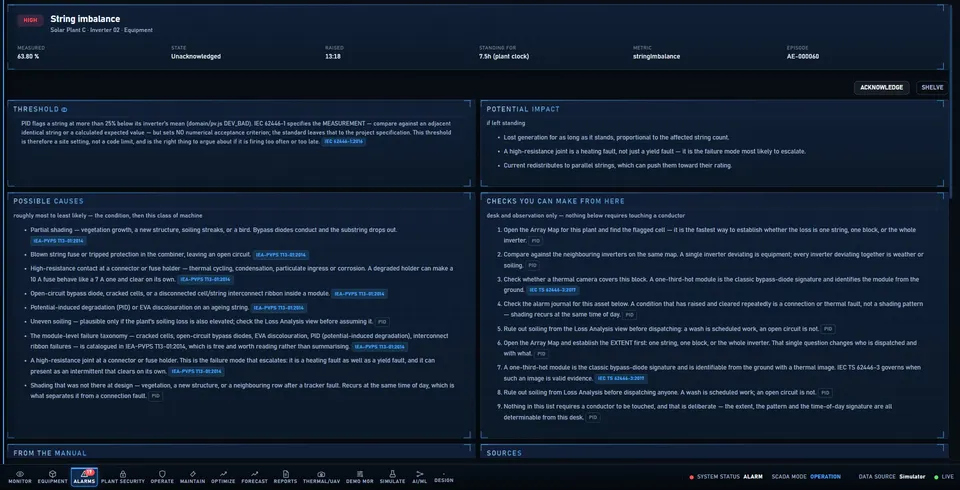
Alarm analytics answers what the live console cannot: how many, how often, how long, how fast anyone responded, and which equipment generates them. A 7-day button stays disabled until the journal actually holds seven days. The response page explains a single alarm: what was measured against what, likely causes, the device's history and the work order that exists for it. It deliberately does not list live-DC switching steps: those belong to site procedures and qualified staff, not to a dashboard.
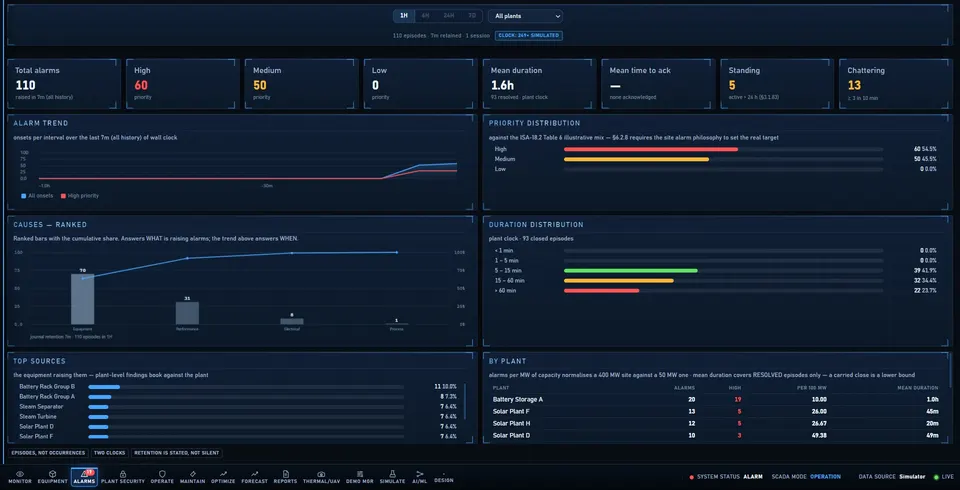
Alarm analytics: counts, rates, durations, causes and the plants raising the most alarms
Screens shown use simulated demonstration data.
Alarm response page for a string imbalance alarm: threshold, possible causes, potential impact and checks from the desk
Screens shown use simulated demonstration data.

Equipment › Single Line

Single-line diagram

The SLD is generated per plant from the device tree, not a fixed picture with numbers pasted on. A plant with six inverters draws six.
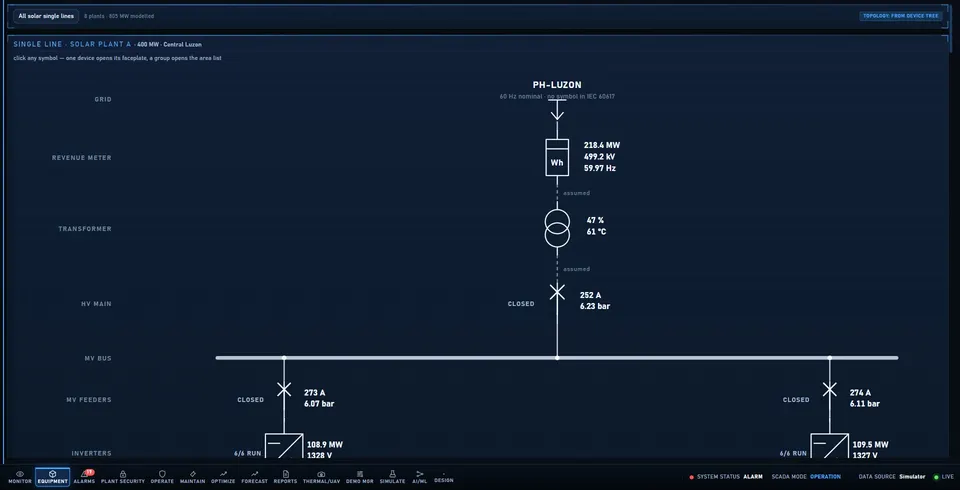
  • Drawn from real topology. Strings to inverters to feeders to bus to transformer to meter.
  • Live states. Breakers and transformers show their live condition.
  • Navigational spine. Click any element to open its faceplate.
Single-line diagram generated from the device tree: grid, revenue meter, transformer, HV main, MV bus and feeders
Screens shown use simulated demonstration data.

Equipment › Array Map, Tree and Array 3D

Where to walk

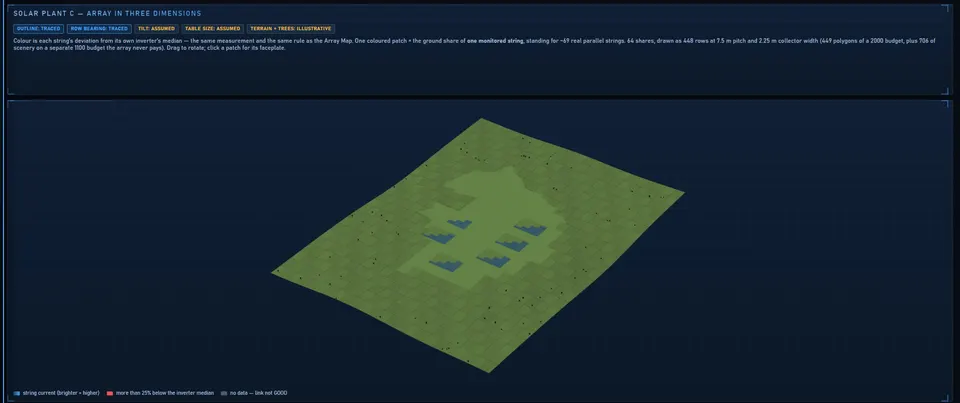
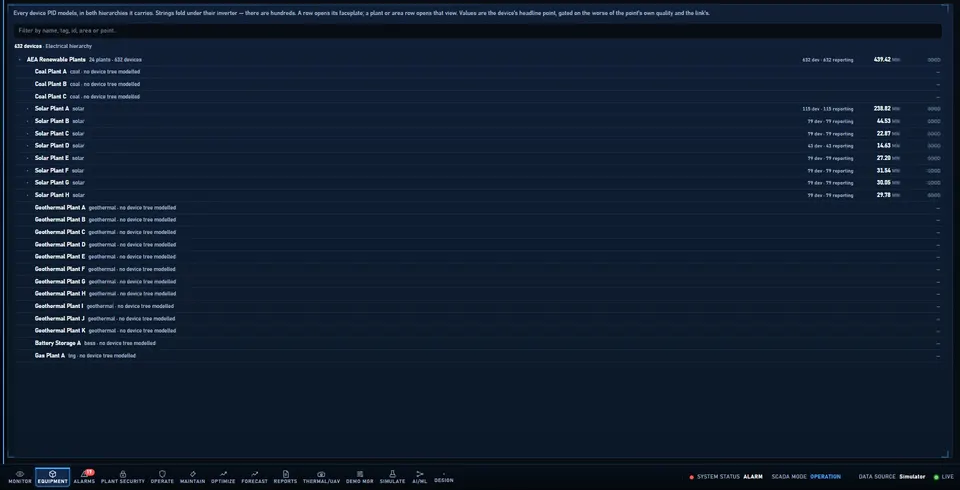
The array map is a plan view of a solar site. Each string is coloured by how it compares with its own array, which tells a technician where to walk. The equipment tree shows every asset at once and is searchable, so any device can be reached by name. Array 3D shows the same performance data in the shape an engineer at the fence recognises: a labelled diagram, not a survey or digital twin, and the badge says which blocks are measured by a thermal camera.
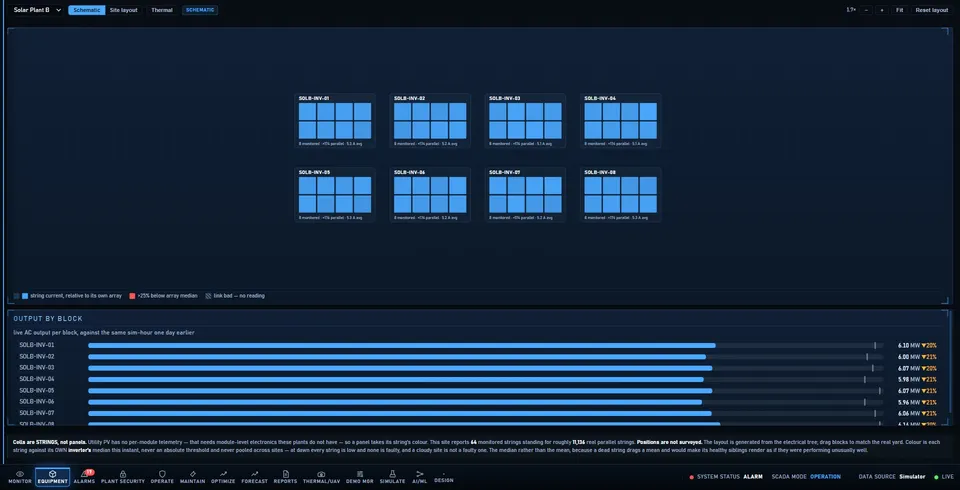
Array performance map: one cell per string, coloured against its own array, with output by block
Screens shown use simulated demonstration data.
Equipment tree: fleet, plant, area, device and point, searchable
Screens shown use simulated demonstration data.
Array 3D: module tables on the traced site outline, with badges saying what is traced and what is assumed
Screens shown use simulated demonstration data.

Asset condition

Electrical asset condition, not just raw points

Transformer, switchgear and feeder faceplates for substations and plants. A utility or factory sees the condition of the asset, with the same faceplate whether the data arrives by IEC 104, DNP3, Modbus or OPC UA.

Power transformers

  • Dissolved gas analysis (DGA) and core health
  • OLTC tap position
  • Top-oil and winding temperature
  • Load against nameplate, estimated life

Switchgear and breakers

  • SF₆ gas density
  • Contact wear from operations
  • Open, closed or tripped state live on the SLD
  • Thermal hotspot on terminations

Feeders and substations

  • Phase current and feeder load
  • Substation grouped by plant or grid
  • Comms quality per device
  • One click from SLD to faceplate

Generation mix

One platform for the whole generation mix

Technology views are generated from the fleet: one per technology present. Solar, battery, geothermal, coal and LNG/gas are supported. Add a technology to the fleet and its view appears; no new screen has to be written.
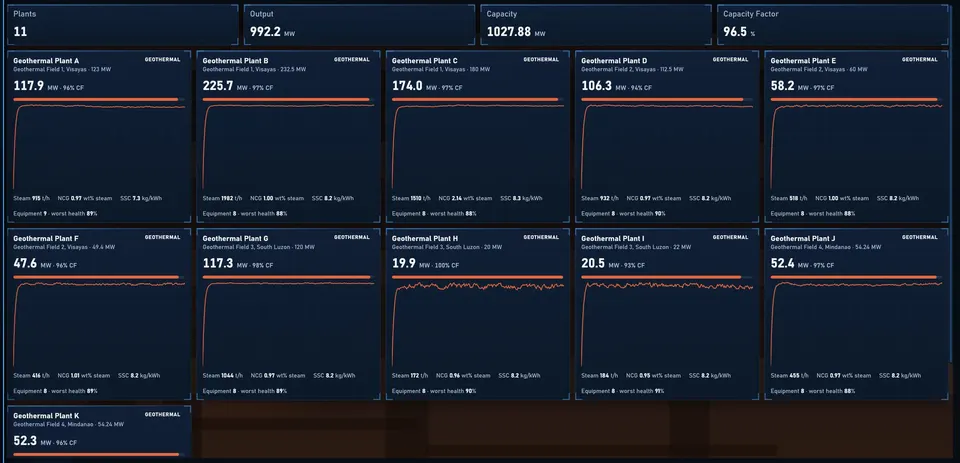
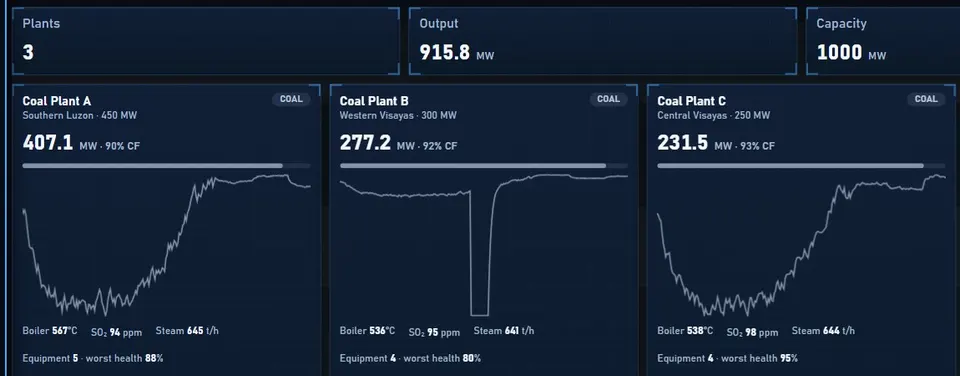
  • Geothermal. Unit-by-unit output and condition for geothermal plants.
  • Coal. Coal unit output, with heat-rate analysis in Optimize.
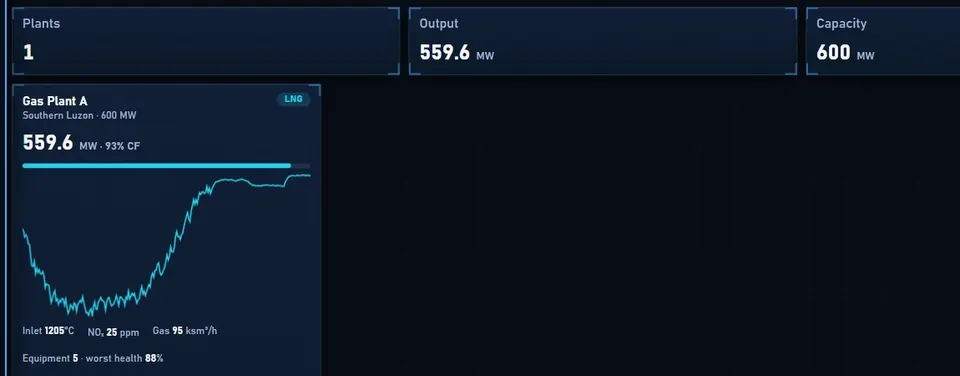
  • LNG and gas. Gas plant output alongside the rest of the fleet.
Geothermal generation view: unit-by-unit output, steam, NCG and equipment health for eleven plants
Screens shown use simulated demonstration data.
Coal generation view: three units with output, capacity factor, boiler temperature, SO2 and steam flow
Screens shown use simulated demonstration data.
LNG and gas generation view: output, capacity factor, inlet temperature, NOx and gas flow
Screens shown use simulated demonstration data.

Steam Field › Layout and Performance

Steam field layout and performance

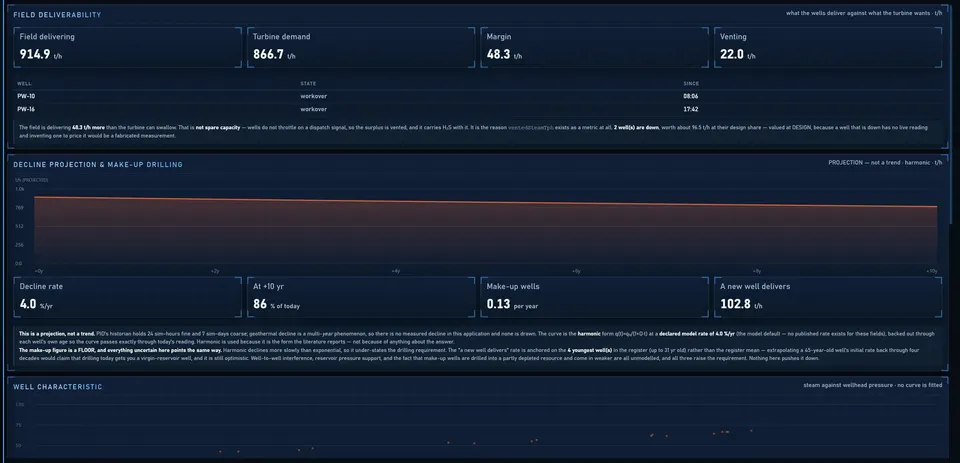
The steam field layout draws wells, separators and pipelines; engineers drag elements to match the field. Performance answers four separate questions: deliverability now, decline over years, each well, and the cost of the gathering system.
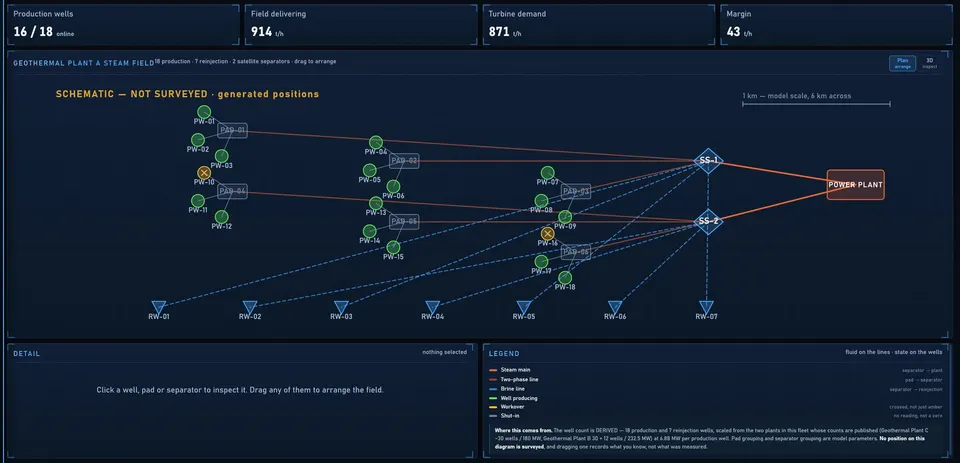
  • Positions are badged as generated until surveyed positions replace them.
  • The decline chart is a projection, with the drilling needed to hold output, and its axis says so.
Steam field layout: wells, pads, separators and pipelines, badged as a schematic with generated positions
Screens shown use simulated demonstration data.
Steam field performance: field deliverability against turbine demand, decline projection and make-up drilling
Screens shown use simulated demonstration data.

Optimize › Steam Analysis

Steam and heat-rate analysis

The steam-side counterpart to solar loss analysis. Geothermal decomposes wellhead steam into megawatts; coal decomposes design heat rate into actual. Each loss is sized so the worth-fixing items stand out.
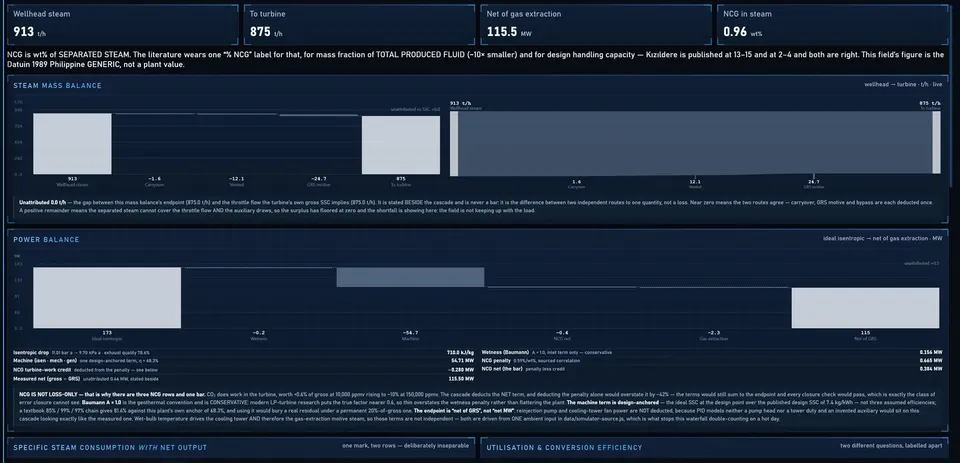
Steam utilisation and loss: wellhead steam to megawatts, decomposed, with every term sourced
Screens shown use simulated demonstration data.

Operate › Door Access

Door access across sites

Door access answers one question: is anything wrong at this site. Doors are grouped by plant, because a site is where someone can be sent. Door commands are the only write function in APEX and are authorised in the main process against the signed-in operator's role.
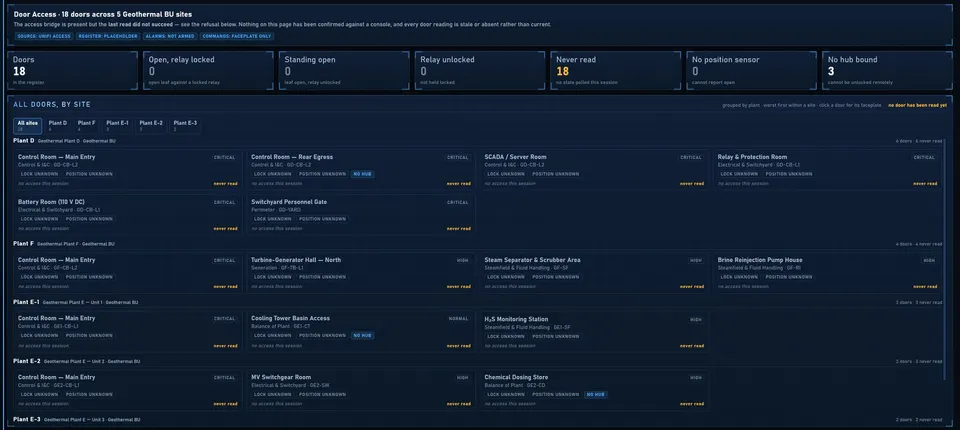
  • Lock, relay, door leaf. Each door's lock state, relay and position at a glance.
  • Role-authorised unlock. Remote unlock only from the door faceplate, checked against the operator's role.
  • Only command in APEX. APEX commands doors and nothing else; plant equipment is read-only.
Door access: eighteen doors across five geothermal sites, grouped by plant, every reading badged as never read
Screens shown use simulated demonstration data.

See APEX run on a simulated fleet, then scope your plants

Showcase mode walks the important functions in about four minutes. After that we list your SCADA points, protocols and camera positions.