
Monitor
Fleet, plant, area, trends, cameras
Platform
Every function sits under one of these tabs. The rail minimises itself automatically, and all thirteen tabs fit on one bar without scrolling.
Fleet, plant, area, trends, cameras
Single-line diagram, array map, equipment tree, Array 3D
Console, analytics, response
Control center, protocols, doors
Predictive maintenance, work list
Losses, steam analysis, reports
24-hour and 7-day output
Per-plant PDF reports
Thermal cameras, drone
Showcase and demo plants
Scenarios, field data, output sandbox
How each smart function works
PV array sizing
Specification
What the current build does, stated the way a tender evaluator would ask for it.
Figures above describe the current build and are checked against the application before publication.
ISA-101 hierarchy
Screens follow the ISA-101 high-performance HMI hierarchy, so an operator always knows which level they are looking at.
Every string, inverter and breaker is one click from the screen above it.
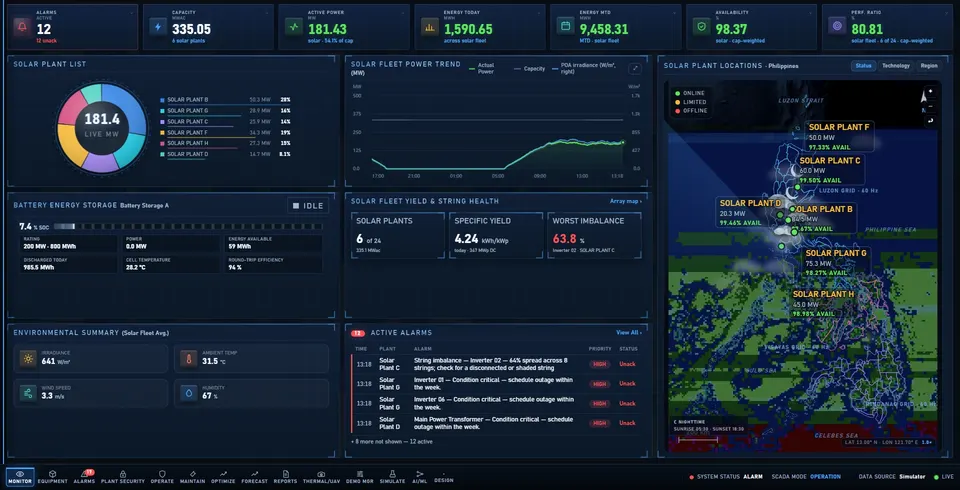
Every function
Fleet, plant and area views, trending, the Remote Control Center and the grid mesh.
Read moreCamera wall, PTZ control, peak hold and audible alarms, commissioning, thermal history, 24/7 recordings and event replay.
Read moreAlarm console, analytics and response; SLD, array map, equipment tree and Array 3D; transformer and switchgear condition; every generation technology; steam field; door access.
Read moreForecasting, loss analysis and cleaning economics, predictive maintenance, executive reports, simulation, PV design, the assistant and the AI/ML page.
Read moreFive field protocols in and an OPC UA server out, system health, sign-in and operator roles, a signed installer, branding and showcase mode.
Read moreShowcase mode walks the important functions in about four minutes. After that we list your SCADA points, protocols and camera positions.