
Platform · 01
Monitor and operate
What every plant is doing right now: Fleet Overview, plant and area detail, historical trending, Remote Control Center and grid mesh.
Monitor › Fleet Overview
The whole fleet on one screen
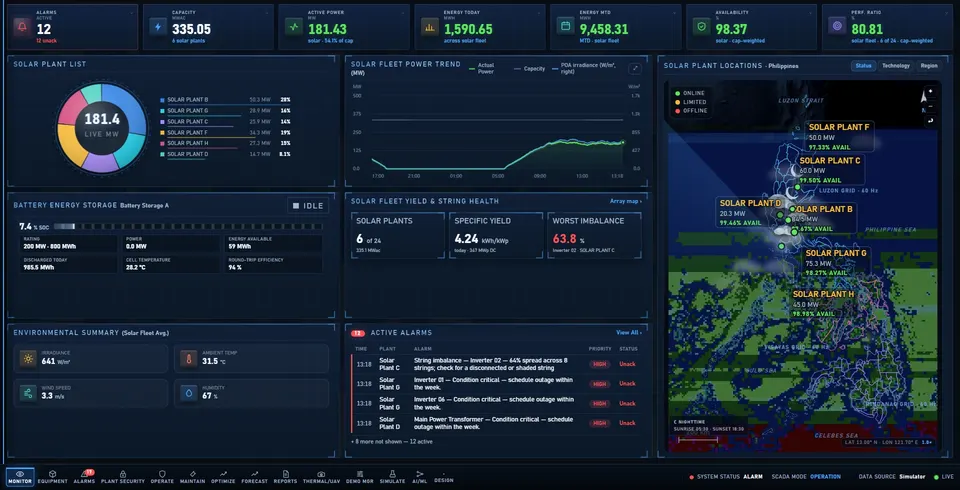
The Fleet Overview is the home screen: a 7-tile KPI strip, plant list and power trend, battery storage, string health, environmental summary, active alarms and the live plant map.
- 7-tile KPI strip. Alarms, capacity, active power, energy today and month, availability, performance ratio.
- Live map. Every site on a Philippine map, coloured online, limited or offline.
- Battery storage. State of charge, charging or discharging, and round-trip efficiency.
- Active alarms. Priority alarms with the action to take, on the first screen.
Monitor › Plant and Area
Plant and area detail
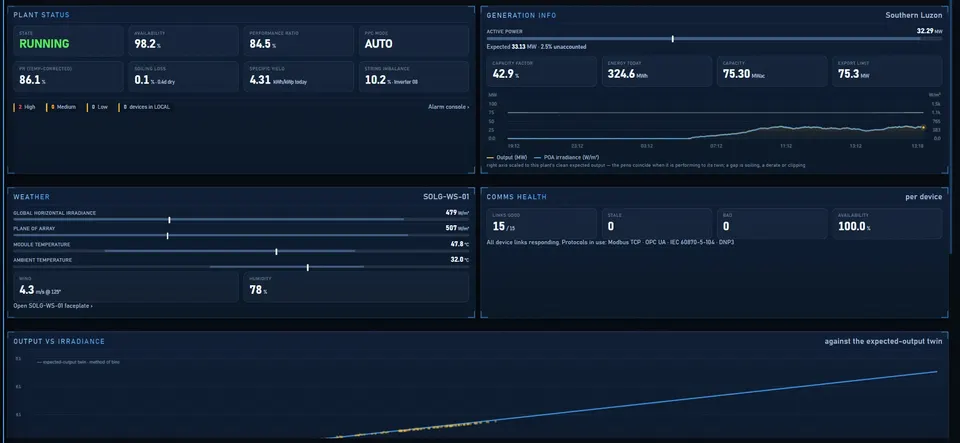
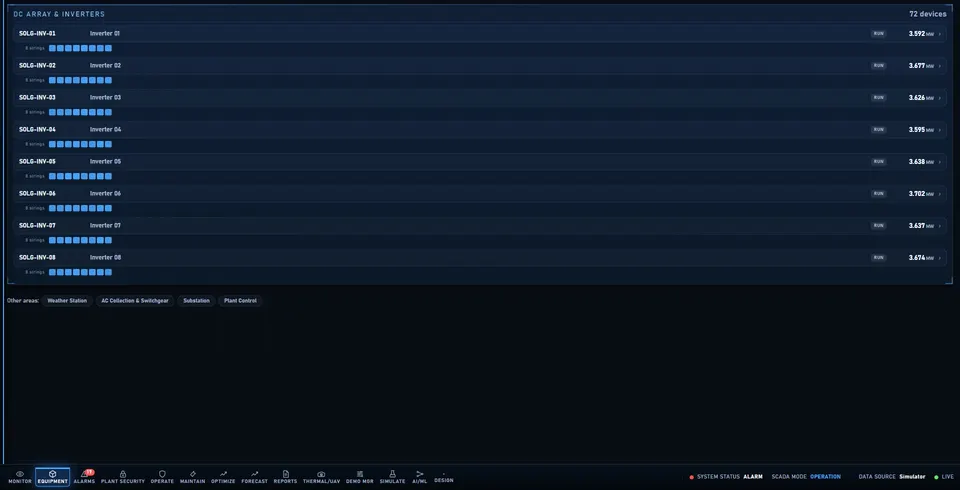
The plant view answers 'how is this plant doing' in four fixed regions an evaluator can mark against: plant status, generation, weather and communications health. The area view lists one section of plant, such as the DC array, AC collection or substation, as devices with live values and comms quality.
- ISA-101 Level 2 and Level 3 screens
- Clicking a device opens its faceplate
Monitor › Trending
Compare any two signals over time
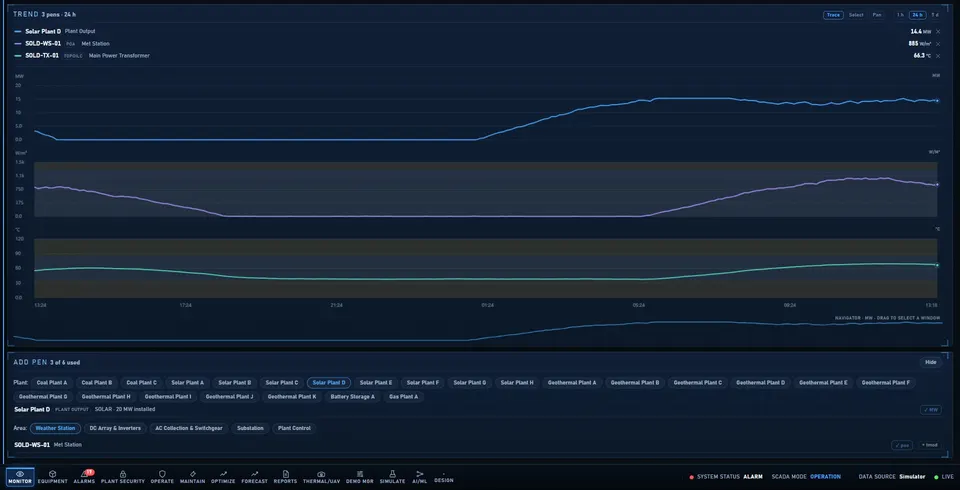
Trending is the historian viewer every SCADA HMI needs. Pick pens and a range. When units differ, APEX draws one chart per unit rather than normalising everything onto one misleading axis.
- Any points. Such as POA irradiance next to the inverter output it explains.
- Pick a range. Scroll back through history and read the shapes.
- Honest axes. Mixed units get one chart per unit, never one stretched axis.
- Light or dark. Readable in the control room and in the office.
Operate › Remote Control Center
Operate from a regional control center
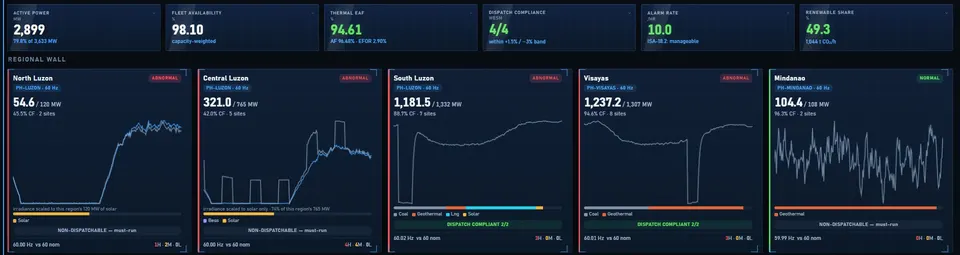
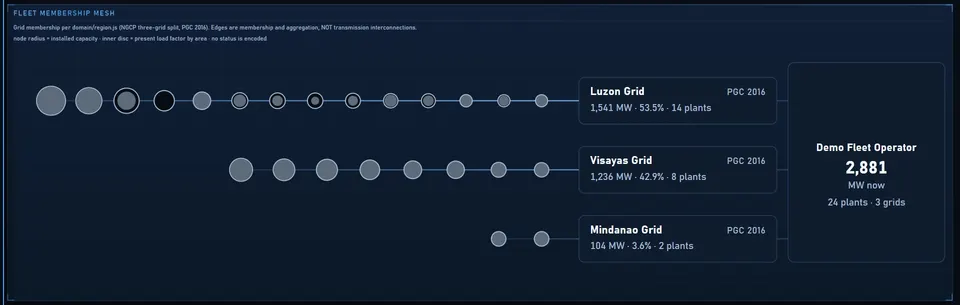
The Remote Control Center is a dense, always-live wall for a regional operator, with a drill-down panel. The grid mesh groups plants by the NGCP grid they belong to.
- One colour, one meaning. Red, amber and green are status only; technology colours appear only on the mix bar.
- Grid mesh lines show membership, not transmission lines, and the screen says so. APEX will not draw transmission it has no data for.
See APEX run on a simulated fleet, then scope your plants
Showcase mode walks the important functions in about four minutes. After that we list your SCADA points, protocols and camera positions.