
Platform · 04
Turn data into energy and money recovered
Forecasting and 7-day outlook. Loss analysis and cleaning economics. Predictive maintenance and reports. Simulation, PV design, the assistant, and the AI/ML page that shows how every smart function works.
Forecast
Forecasting
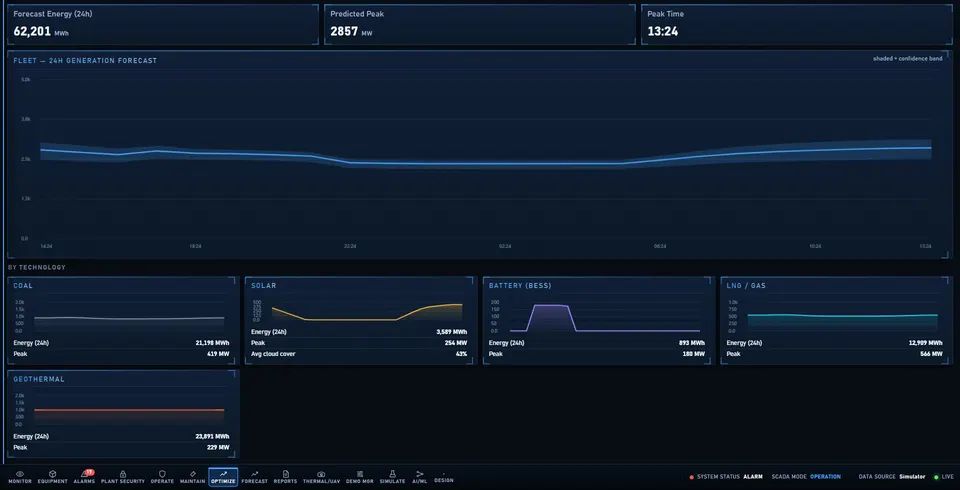
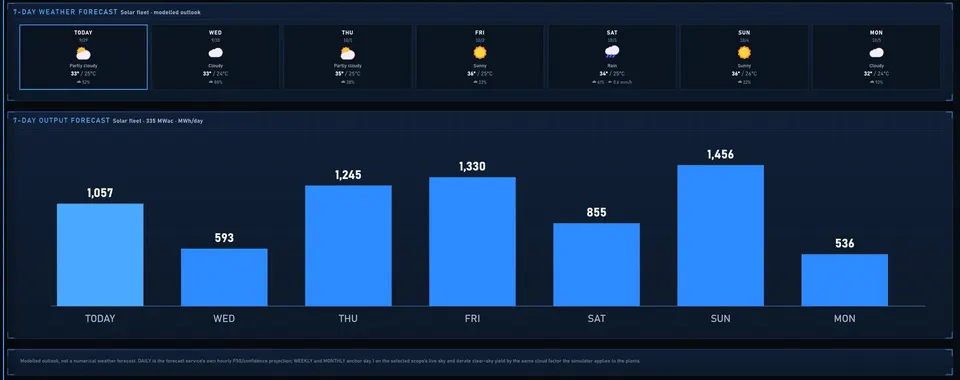
The forecast gives a 24-hour fleet outlook with a confidence band and a per-technology breakdown, plus a 7-day view.
- Plan dispatch and maintenance around the weather.
- Method shown openly: a clear-sky curve adjusted for cloud cover, explained on the AI/ML page.
Optimize › Losses
Loss analysis and cleaning schedule
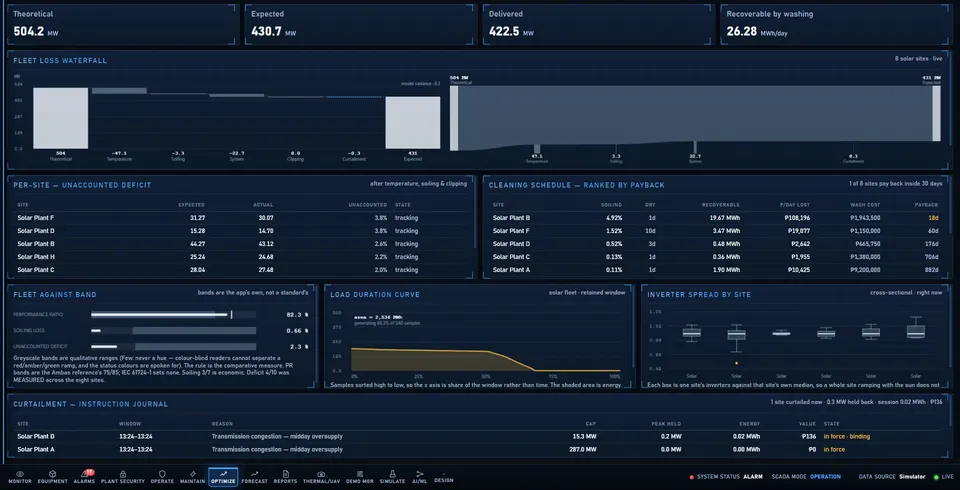
Loss analysis decomposes theoretical energy into delivered energy, so every lost kWh has a cause and an owner, then shows which losses are worth paying to recover, such as when to wash.
- Theoretical to delivered. A waterfall where every lost kWh has a cause.
- Every loss has an owner. Soiling, clipping, temperature, availability and more.
- Cleaning economics. Which soiling loss is worth paying to recover.
Maintain
Predictive maintenance
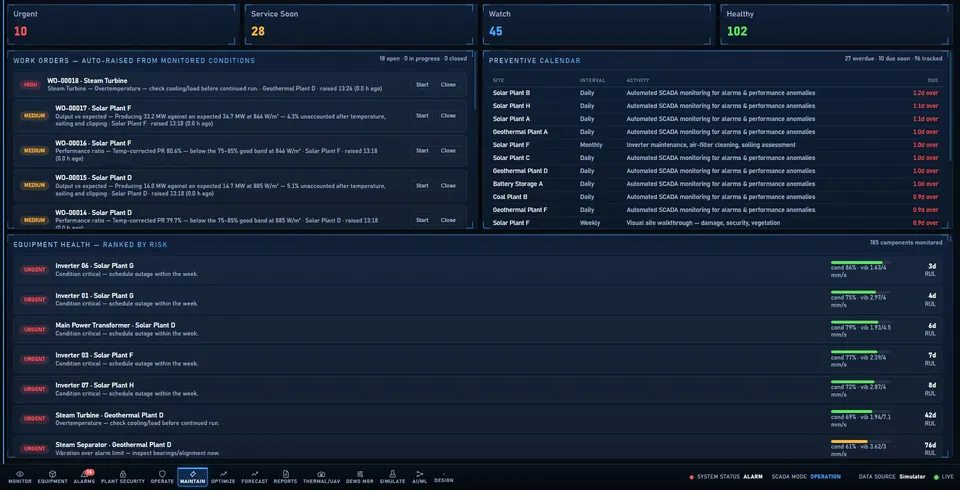
Equipment is ranked by risk with health bars, remaining useful life and recommended actions. The method, rule-based health scoring with a linear trend, is shown on the AI/ML page.
- Health score. Equipment ranked by risk with a health bar.
- Remaining useful life. Estimated from the health trend.
- Recommended action. What to do, and a one-page O&M work list.
Reports
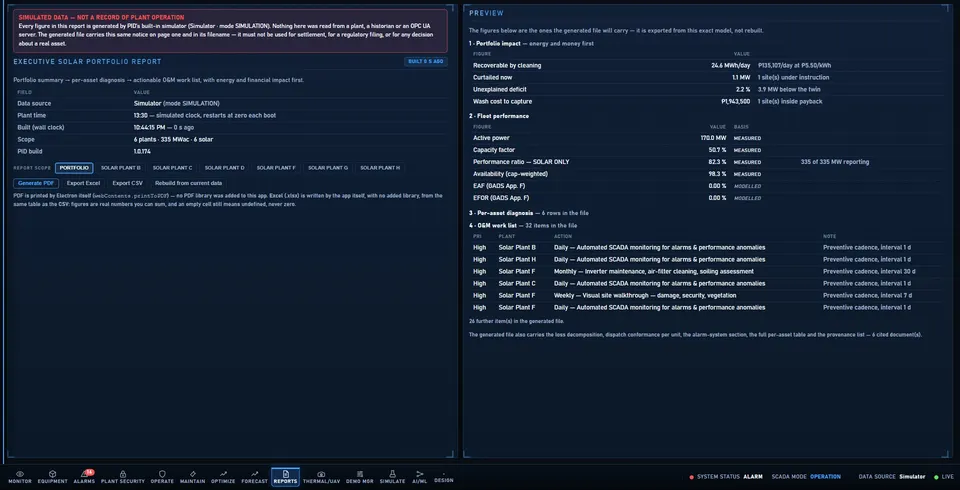
Executive reporting
Reports are a first-class tab, not a hidden button. A report leads with recoverable energy and money, the same question loss analysis and forecasting answer, at portfolio scale.
- PDF reports. Generated in the app, opened or downloaded.
- Per-plant scope. One plant or the whole portfolio.
- Leads with recoverable energy. Energy and money first, in a form that can be emailed.
- Your logo on every report. The customer's mark heads each PDF.
Simulate and Design
Simulate and design
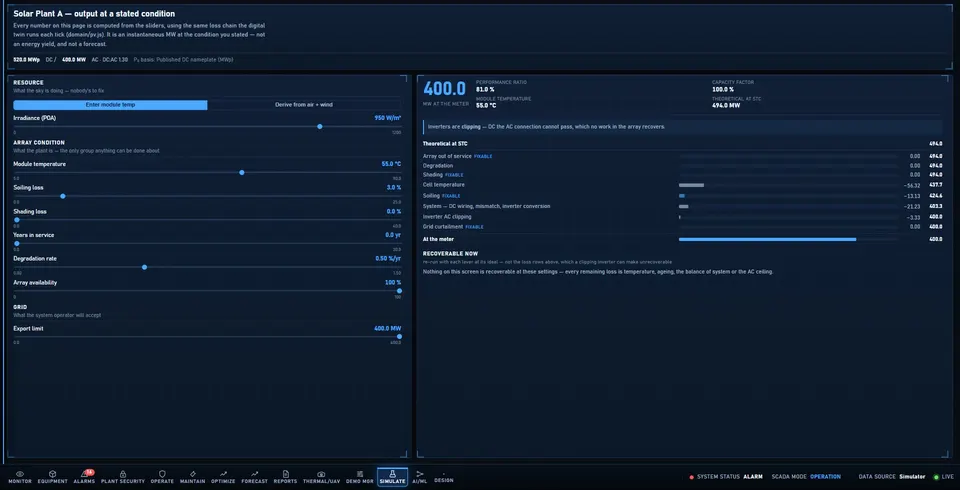
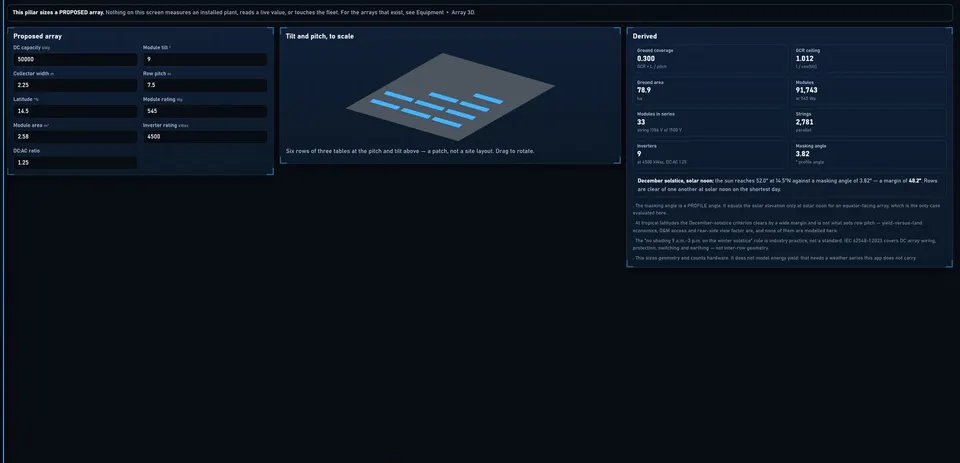
The output sandbox takes a real array and asks what it would produce under a condition you type. PV design sizes a plant that does not yet exist, in its own pillar so it can never be confused with a real one.
- Output sandbox: irradiance, temperature, soiling, shading, age, availability, export limit, with the full loss chain.
- PV design: capacity, tilt and row pitch in; coverage, area, shading angle and module, string and inverter counts out.
Simulate › Scenarios
Scenarios, training and the demo route
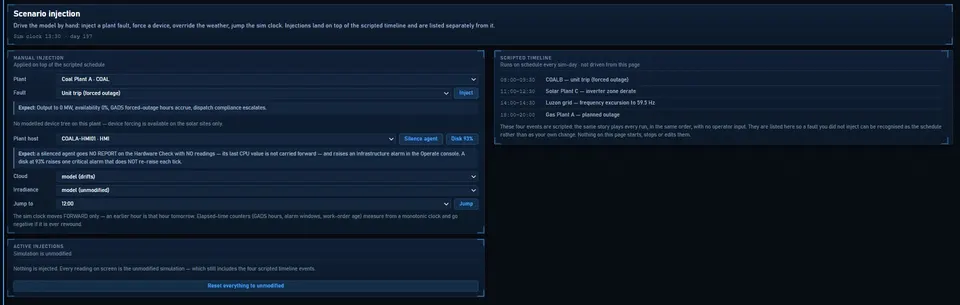
Scenario controls exist only on the simulator. Inject a fault, trip a plant, derate it, stop an inverter, dim the sun or jump to midday, and watch alarms, the loss model and dispatch state react exactly as they would live.
- Never on live data. Controls are disabled whenever a real plant is the source.
- Scripted timeline beside it. Four fixed events per simulated day, shown separately and read-only.
AI/ML
Operations assistant and AI/ML transparency
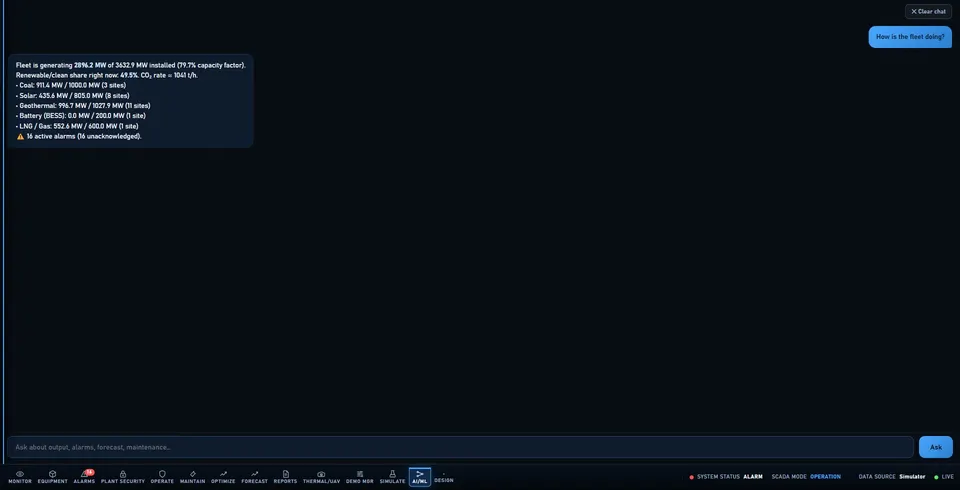
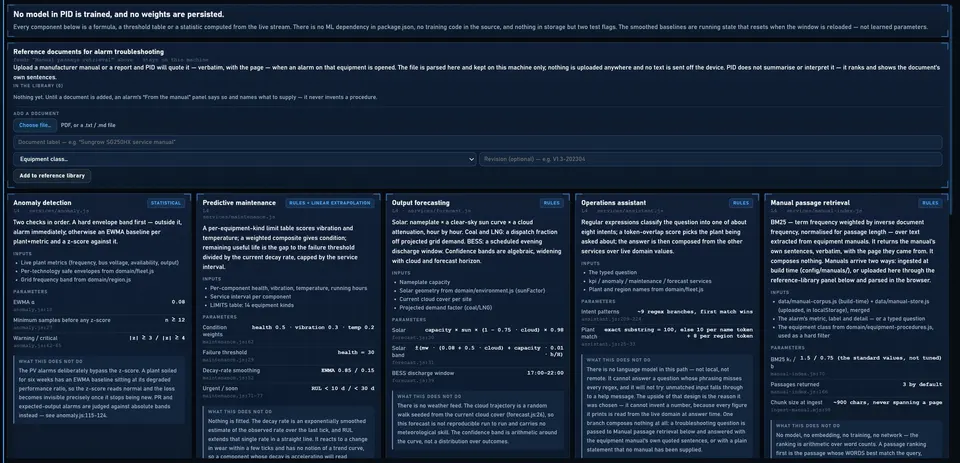
Ask questions in plain words, and see exactly how every smart function works. No model in APEX is trained: anomaly detection uses a smoothed baseline and z-score; predictive maintenance uses rules plus linear extrapolation; the forecast is a clear-sky curve with cloud cover; the assistant classifies intent with patterns and answers from the live services; manual retrieval ranks passages with BM25. That honesty is a selling point.
- Explainable by design: method, inputs and parameters for each function, and what each one does not do.
- Upload O&M manuals and the assistant ranks the matching passages, quoted word for word.
See APEX run on a simulated fleet, then scope your plants
Showcase mode walks the important functions in about four minutes. After that we list your SCADA points, protocols and camera positions.