
Platform · 02
Live thermal cameras built into the console
Camera wall, PTZ control, zoom and crosshairs; peak hold and audible thermal alarms; commissioning, thermal history and analytics; 24/7 recordings and event replay.
Monitor › Cameras
Live thermal and visual cameras, built in
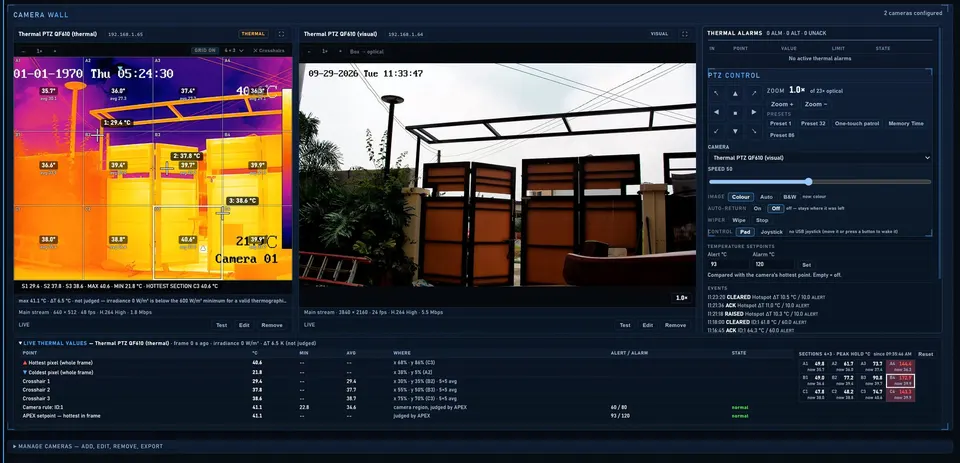
The camera wall shows every camera's thermal and visual streams. If live video is unavailable it falls back to fast snapshots and says so. Alert and alarm setpoints are per camera.
- Two streams per camera. Radiometric thermal and HD visual side by side from one dual PTZ camera.
- Section grid. The thermal picture is split into sections, each with its own live peak.
- Setpoints per camera. Alert and alarm temperatures raise APEX alarms automatically.
- Camera registry. Add, edit and test cameras from the same screen.
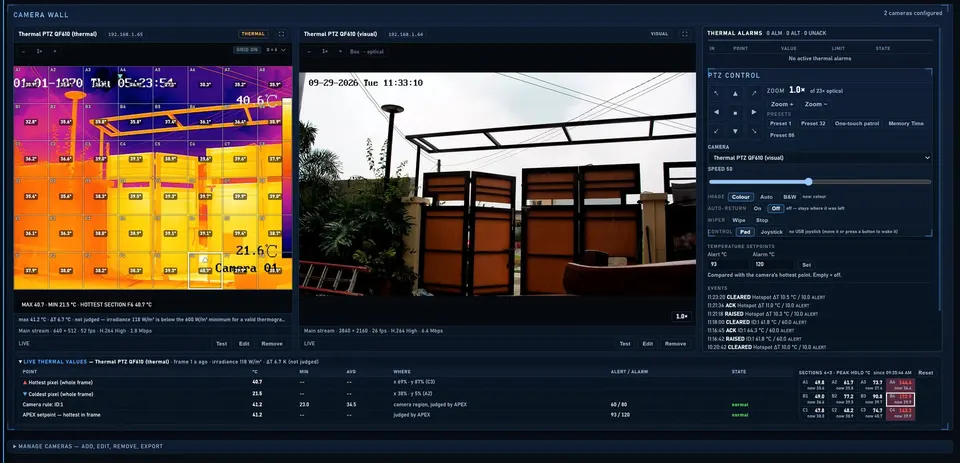
Section grid and crosshairs
Measure exactly where you point
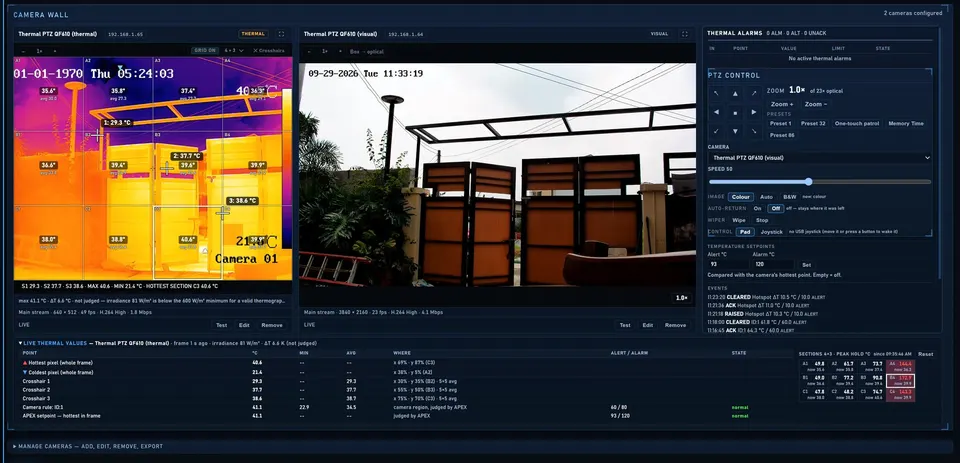
The section grid divides the thermal frame. Crosshairs can be dropped anywhere by clicking, several at a time, and cleared in one click. Every overlay is positioned through the same mapping so it stays aligned when zoomed.
- Section grid. Each section of the image carries its own peak temperature.
- Crosshairs. Click the picture to drop crosshairs; several can be placed at once.
- Clear in one click. Remove every crosshair with one button.
- Works while zoomed. Overlays stay on the right spot through zoom and pan.
Zoom and PTZ
Zoom in and steer the camera
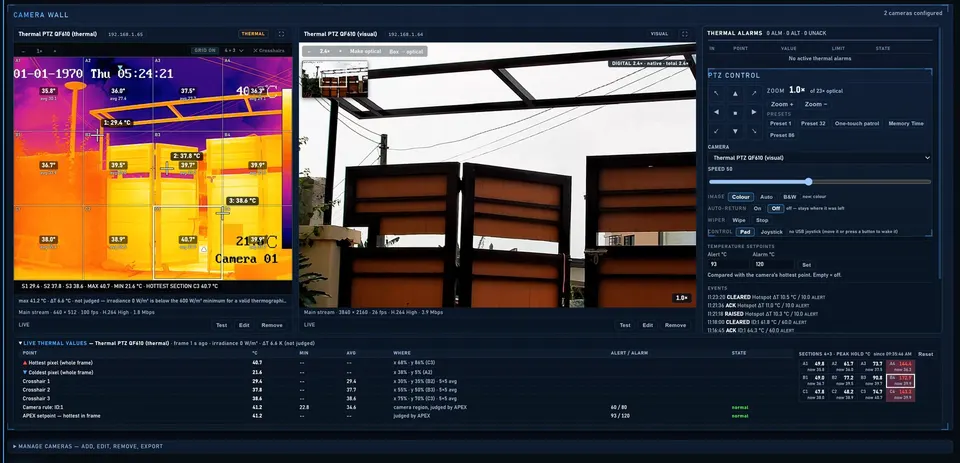
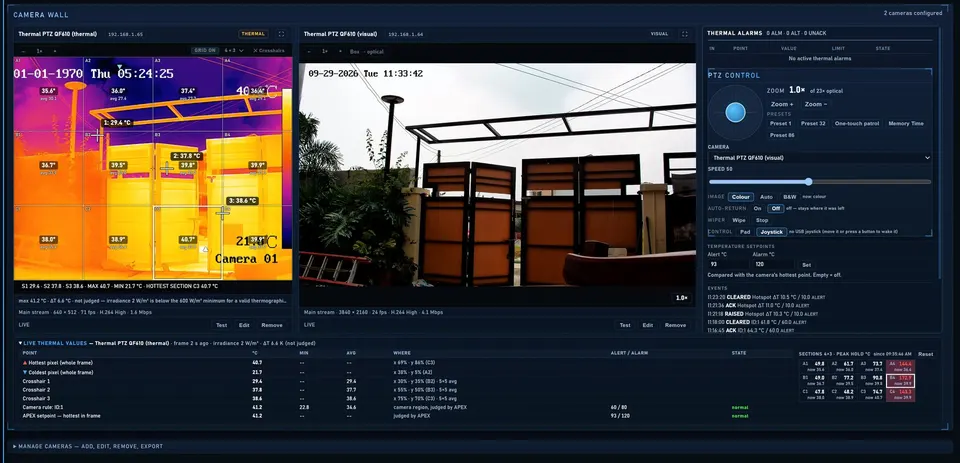
Digital zoom works on both streams, with a mini-map so the operator never loses their place. The joystick steers the physical PTZ head.
- Digital zoom with mouse wheel and drag to pan; double-click returns to 1×.
- PTZ joystick drives the physical camera's pan and tilt, on screen or from a USB joystick.
Live values, peak hold and alarms
Readings an operator cannot miss
The thermal annunciator works on every view, following ISA-18.2: an unacknowledged alarm sounds a continuous two-tone horn and flashes the banner and camera tile; an alert gives a double beep every few seconds. Acknowledge silences it. Peak hold keeps the hottest reading until reset.
- Live thermal values. Current temperature for every section and rule.
- Peak hold. The hottest reading is held until an operator resets it.
- Audible alarm. Unacknowledged alarms sound a horn and flash, on every screen.
- Acknowledge. Silences and steadies the alarm until it clears.
Thermal/UAV › Thermal Cameras
Commission a new thermal camera with confidence
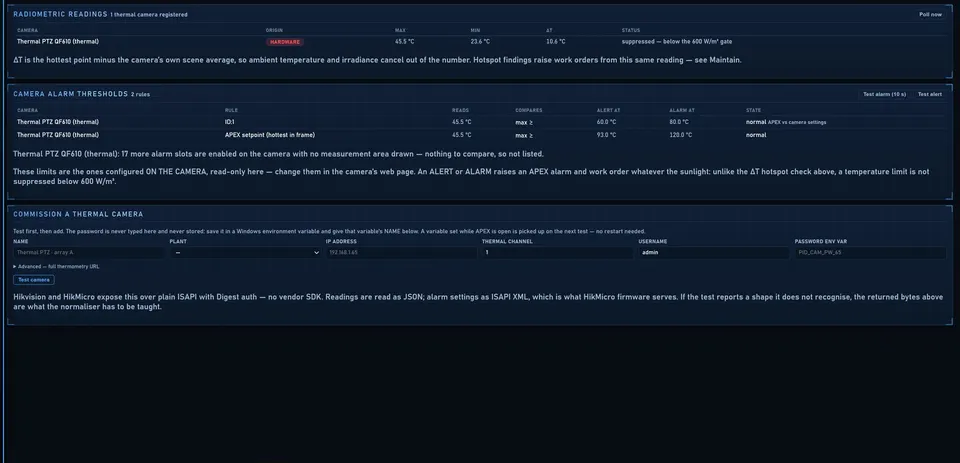
The commissioning form tells an engineer exactly which step fails when a camera is added: network, login, content type or data format, with a sample of what came back. A reading below the irradiance gate is shown as suppressed, which is correct behaviour, not a fault.
- Readings table. Every reading marked HARDWARE or SIMULATED, with max, min and ΔT.
- Step-by-step test. Reachable, authentication, content type and data parsed, each reported separately.
- Irradiance gate. Solar hot-spot checks run only above 600 W/m², shown as a status, not an error.
- No stored passwords. APEX stores only the name of the variable holding the password.
Monitor › Thermal History
Thermal history shows which hot spots are getting worse
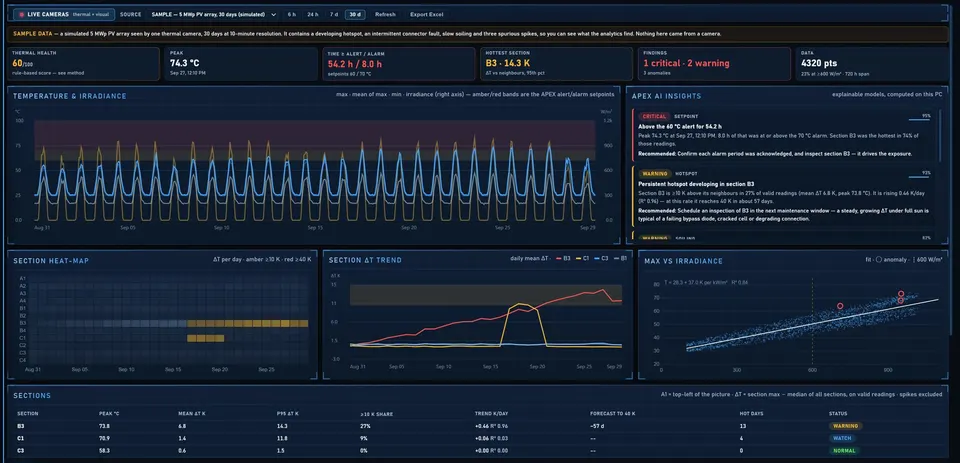
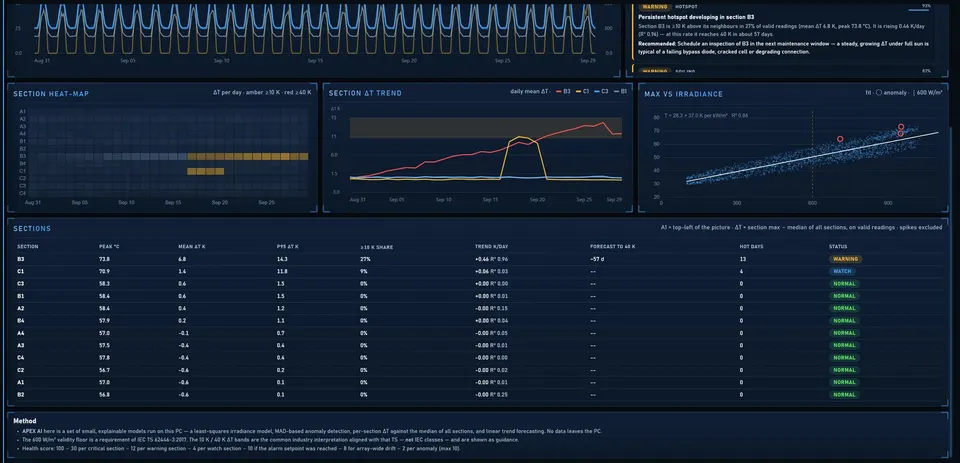
Thermal history stores readings from a real camera. Graphs show temperature against irradiance with the alert and alarm bands, the section ΔT trend, a section-by-day heat-map, and maximum temperature against irradiance with the fitted model and anomalies flagged.
- APEX insights: each finding with its evidence, a recommended action and a confidence level.
- Heat-map and section ΔT trend show which section is warming day after day; the sample dataset is always stamped SAMPLE.
Monitor › Recordings
24/7 recording on one timeline
Recording runs 24/7 for both streams. The timeline shows coverage and events for the day. Both players run on one clock so they stay in step; 4× and faster plays keyframes only, like any NVR.
- Continuous recording of thermal and visual, with storage used shown.
- 24-hour timeline. Each camera's coverage and event markers; click to jump there.
- Synced players. Thermal and visual on one clock, from 0.5× to 8×, ±10 s steps.
- Manual events. Record event and Stop buttons for anything the operator wants kept.
Event replay
Replay any event with its thermal readings
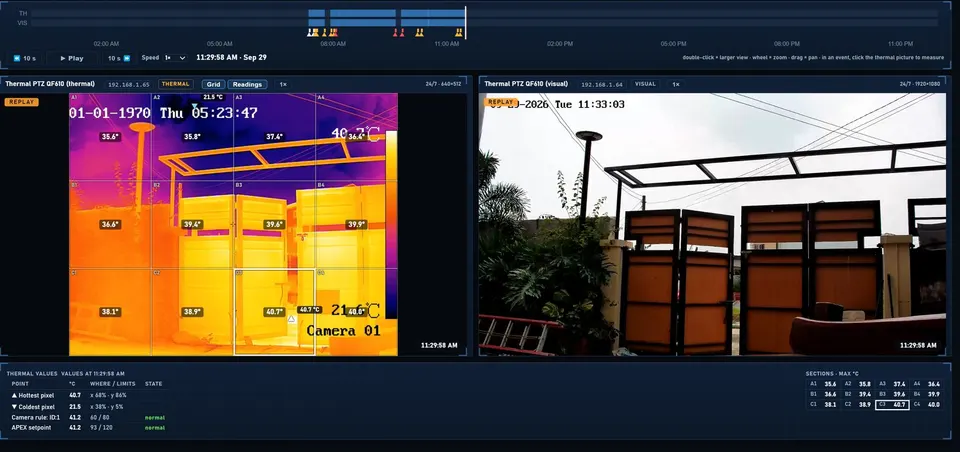
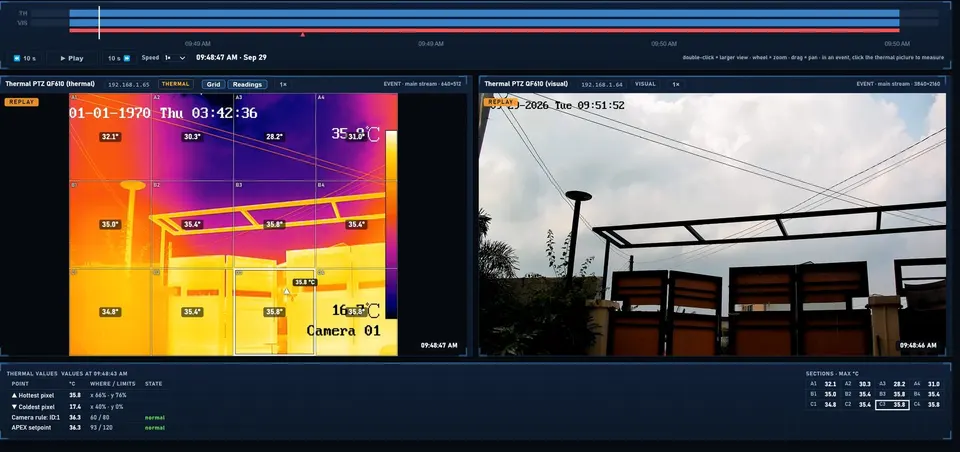
Each thermal alert or alarm creates an event. Replaying it shows the thermal values at the playhead from the recorded data track, so the evidence is the measurement, not just a picture.
- Thermal values at the playhead come from a 3-second data track recorded alongside the video.
- Evidence for O&M: show the contractor exactly what heated up, and when.
Thermal/UAV › Drone view
Drone thermal inspection: on the roadmap
The drone view is planned and not yet in this build. Today it shows NOT RECEIVING and lists exactly what is needed to connect a drone: an RTMP push from the controller, a local relay on site, and a live view in APEX.
- Live picture now, measurement later: the video stream does not carry temperatures, so measured drone ΔT comes from a post-flight import of the radiometric images.
- Labelled as a survey: imported drone readings are badged with their flight time, never shown as live.
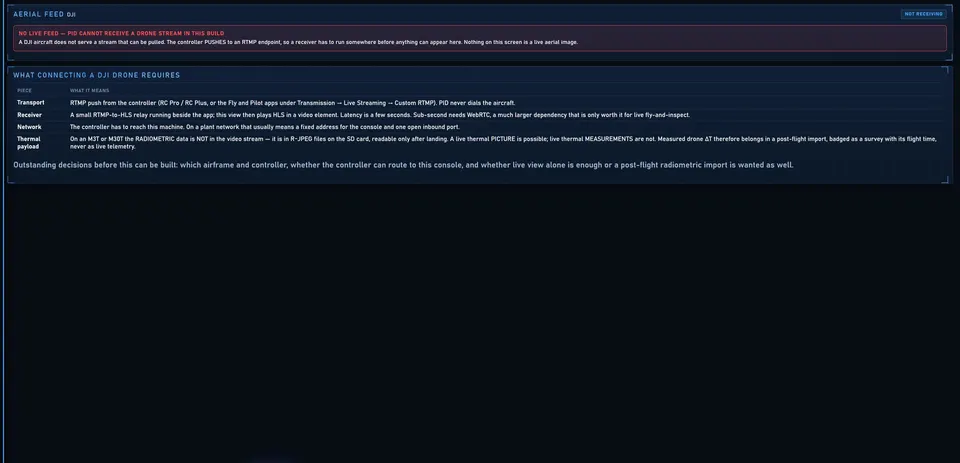
Aerial inspection is a roadmap item. Nothing on this screen is a live aerial image.
See APEX run on a simulated fleet, then scope your plants
Showcase mode walks the important functions in about four minutes. After that we list your SCADA points, protocols and camera positions.